It’s no secret that data powers much of the work done here at the CU Anschutz Medical Campus. But one staffer, self-proclaimed data nerd and Halloween enthusiast Matt Kaskavitch, also applies his analytics expertise to preparations for hosting a robust, efficient – and most of all, fun! – trick-or-treating experience at his Green Valley Ranch home.
A little crazy
“My wife thinks I’m a little crazy for the amount of data I use in our Halloween festivities,” says Kaskavitch, director of digital engagement for the Office of Communications. “Using data allows me to have fun while having the best house on the block for the neighborhood children...and ensure that we don’t run out of candy.”
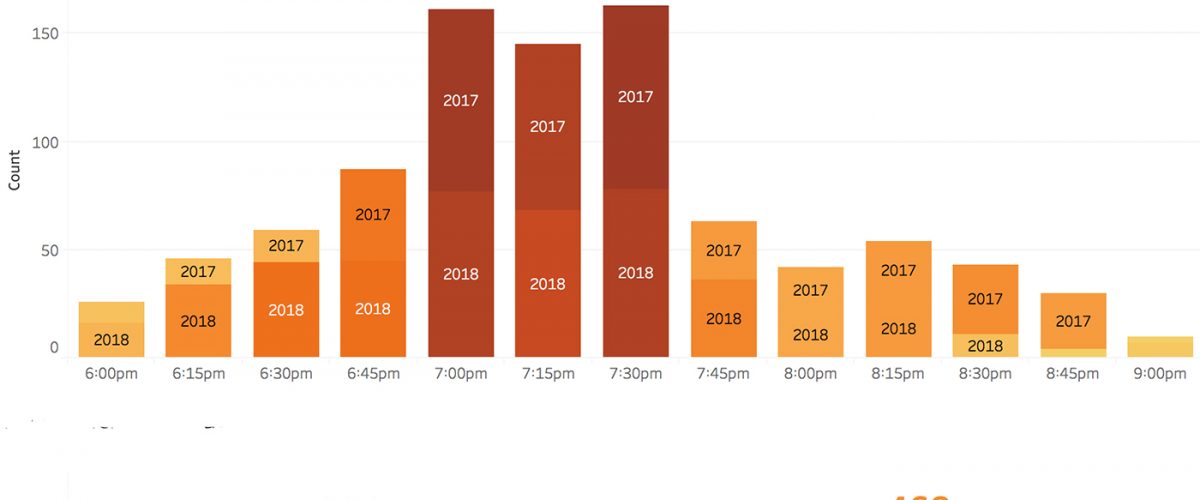
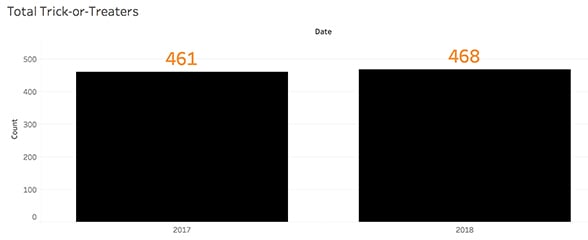
In addition to being fully candy-ready (Kaskavitch and his wife purchased 50 pounds of sweet treats this year based on data sets from last year’s attendance), he also tracks candy disbursement by amount and type (categories include chocolate-based, sugar gelatin-based, and caramel blends), and the number of trick-or-treaters and their arrival times. “When I started doing this I really wanted to understand when I needed to be home from work and when I could begin handing out more candy at just the right pace,” Kaskavitch says. “And we used data from last year to help us purchase more of the treats our neighborhood kids like best,” he adds. (By far, gummy bears out-paced other candies as the ‘hood favorite.)
Spook quotient
Kaskavitch added another pertinent category to his data mining of Halloween 2018: How many kids dressed up in medical-themed costumes. “Sadly, we didn’t have one nurse, doctor, scientist or scrubs-wearing trick-or-treater this year,” Kaskavitch reports. “By far, the most popular costume was a scary clown. And Frozen-inspired wardrobe continues to dominate the Halloween landscape.”
Kaskavitch takes great care to ensure that his own landscape is decked out to maximum “Spook Quotient” effect, and he counts how many children are too frightened by his array of chilling adornments to ask for a treat. “Parents often say ‘Nice job on the decorations; my kid was too scared to come to the door by herself,’” he says proudly.
As of this writing, Kaskavitch is already looking ahead to Halloween 2019. “Sure, I could plan data-driven holiday parties for my family and friends, but that’s not nearly as fun as crunching the numbers to create a super sweet Halloween experience for the kids in our neighborhood,” he says. “I just love using data to make Halloween at our home the best it can be for the children in Green Valley Ranch. I can’t wait to see the look on the goblins’ faces next year.”
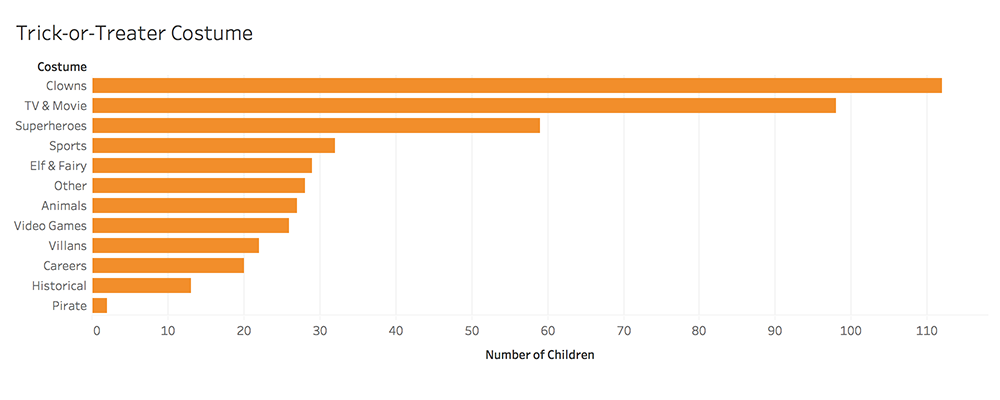 This chart shows the variety of costumes worn by trick-or-treaters visiting the Kaskavitch home in Green Valley Ranch
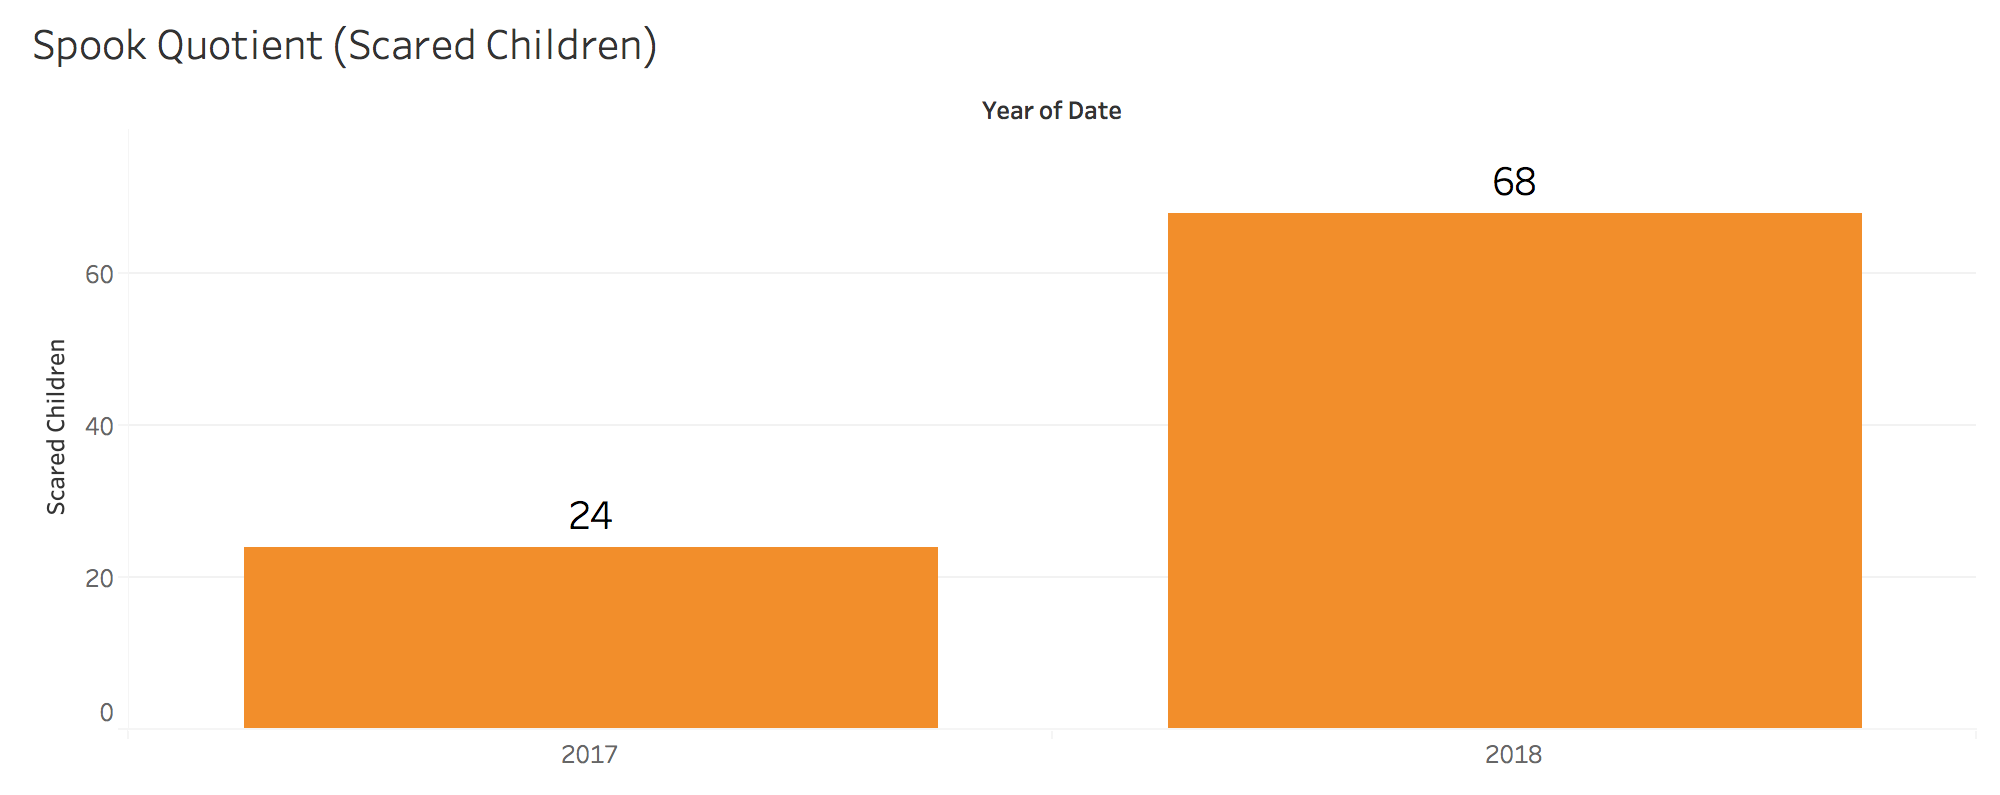 This chart shows the number of children who were too scared to approach Kaskavitch's doorstep without being accompanied by a parent.


